
Why Your Manufacturing Website Gets Traffic But No RFQs: A Diagnostic Playbook
A six-stage diagnostic for manufacturers whose website gets traffic but not RFQs — covering traffic quality, landing pages, buyer evaluation, RFQ forms, and sales handoff.
Download this Playbook
Save the Audit as a PDF.
Use it during your next website review and keep the evidence in one working document.
In this Playbook
Orientation
How to Use This Playbook
- 01This isn't a scored audit. Nobody can turn six different kinds of failure into one clean number, and any tool that claims otherwise is guessing on your behalf. Instead, each stage below ends in one of three calls: healthy, needs attention, or critical, and each call is tied to something you can actually point to, not a feeling.
- 02Before you start, spend five minutes on this: Is Google Analytics (GA4) connected? Is Search Console verified? Does anything fire when your RFQ form is submitted? If any answer is no, start there. Most of the checks below assume that basic tracking already exists.
- 03Once that's in place, work through Stages 1 through 6 in order, or use the decision tree near the end to jump straight to your most likely problem.
You have traffic. You don’t have enough RFQs (requests for quote). That gap is rarely one problem. It’s usually one of six, and several of those stages play out before a visitor ever sees your quote form.
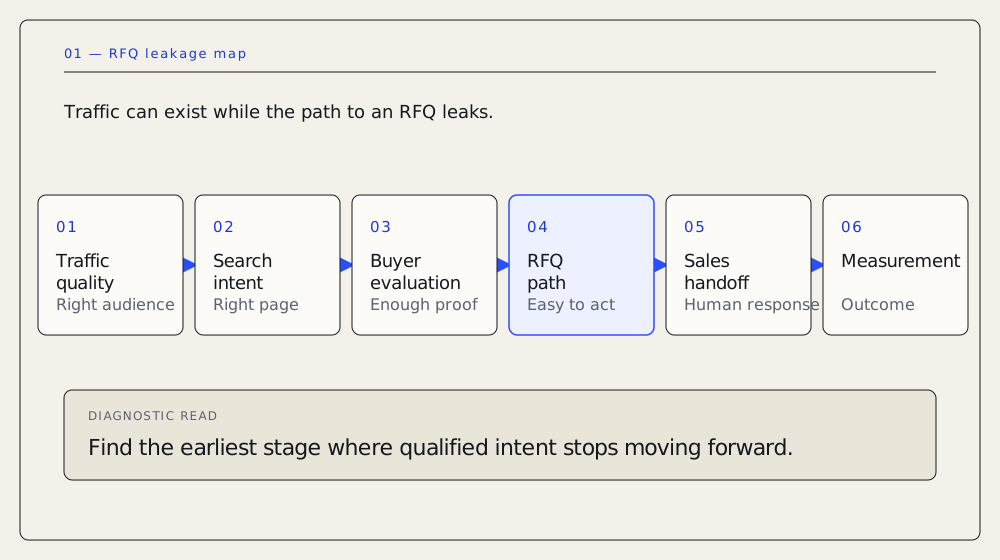
This Playbook walks through those six places a qualified buyer can quietly drop out: traffic quality, search intent, buyer evaluation, the RFQ path itself, sales handoff, and measurement. Work through them in order, or jump straight to the decision tree if you already have a hunch where it hurts.
The Problem: Traffic Doesn’t Equal RFQs
Here’s what makes this different from a normal “we need more traffic” problem: most of your buyer’s evaluation happens before you can see any of it.
Gartner’s research on B2B buying found that buyers spend only about 17% of their total buying time actually meeting with potential suppliers. Nearly all the rest goes to research they do on their own. A separate study from 6sense, covering more than 900 B2B buyers, found that people actively avoid contacting a seller until they’re roughly 70% through their decision. Reaching out earlier doesn’t improve your odds of winning the deal. It can lower them.
Google’s own research with Millward Brown Digital, from 2014, points the same direction. Most B2B researchers start with a generic search, not your brand name, and run around a dozen searches before they ever land on a specific company’s site. By the time a buyer takes an action you can actually measure, in that study they were already roughly 57% of the way to a decision.
None of these numbers are precise enough to build a formula from. But the pattern holds across every source: your website is doing most of its selling long before anyone opens your RFQ form. If you only look at the form, you’re looking at the last 10% of the problem.
STAGE 01 / 06
Traffic quality
What you’re checking: whether the people finding you are the right people at all.
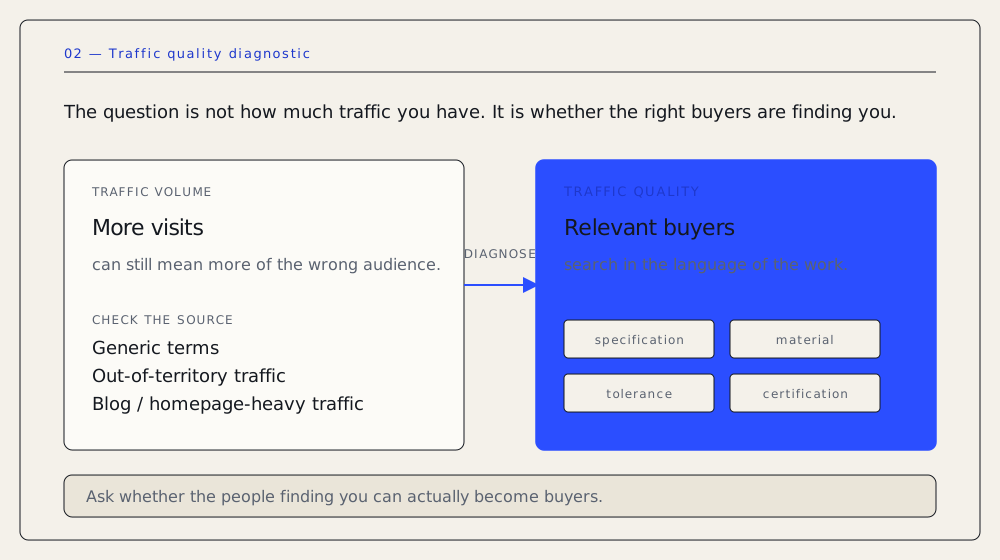
Manufacturing buyers typically search by spec rather than by brand or category: a material grade, a tolerance, a certification, an application. If your organic traffic isn’t built from that kind of language, more traffic won’t fix your RFQ problem. It’ll just bring you more of the wrong visitors.
There’s a second issue specific to manufacturers. You’re often not losing to a handful of named competitors. You’re often losing to Thomasnet, Xometry, and distributors that list your product category. Those sites frequently outrank a manufacturer’s own product pages for the exact terms a buyer is typing in.
Check:
- Do your top organic queries match real products, applications, or specs, or are they generic terms that could describe anyone?
- Does your traffic come from the geographies you actually serve?
- Do your own product pages rank, or do distributor and marketplace listings occupy those spots instead?
- Is that traffic reaching commercial pages, or landing mostly on your blog, homepage, or careers page?
Evidence to pull: Search Console’s queries and impressions by page, GA4 traffic by source and geography, and a manual search for your 10 to 15 highest-value spec and application terms to see who actually ranks for them.
When this is broken, it usually looks like this: you rank for broad terms that pull in researchers or out-of-territory buyers, distributor pages beat your own product pages, and most of your traffic sits on pages that were never going to produce a quote.
What the finding means:
- Healthy: your top queries match real buyer language, and your own pages rank for them.
- Needs attention: you rank for some of the right terms, but distributors beat you on others.
- Critical: most of your visible traffic isn’t an audience that could ever submit a real RFQ.
This is a traffic-quality problem before it is a traffic-volume problem. Spending more to drive traffic to the wrong audience just buys you more of the wrong visitors. It’s also one of the first things we check in an SEO audit.
STAGE 02 / 06
Search intent → landing page
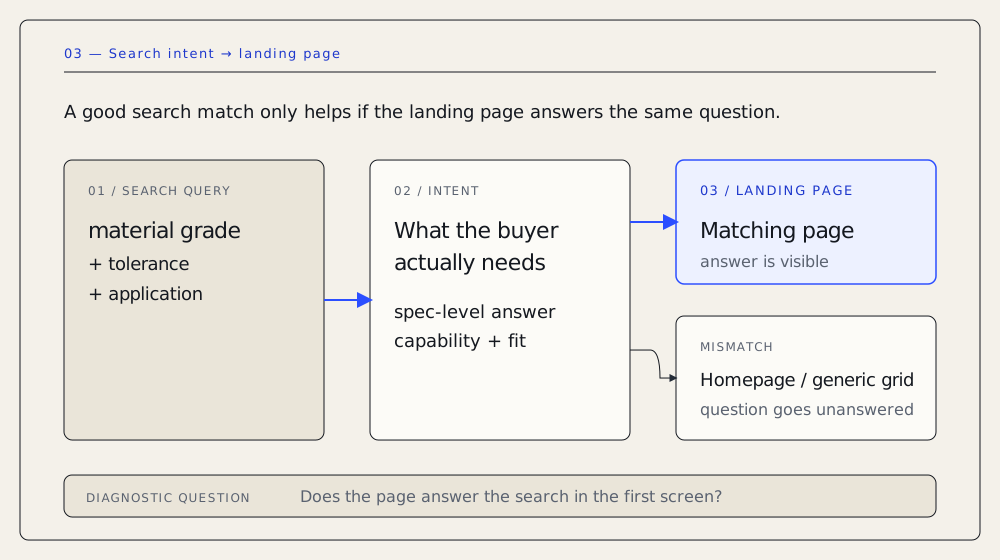
What you’re checking: once someone finds you with the right search, does the page they land on actually answer it?
This is easy to confuse with Stage 1, so here’s the test that separates them: if your analytics show a visitor reaching the correct page for their search, but still leaving without acting, the problem isn’t your audience anymore. It’s the page.
Check:
- For your top ten organic queries, open the actual landing page. Would someone typing that phrase get what they expected in the first screen?
- Is one “catalog” or “products” page trying to rank for dozens of unrelated queries at once?
- Do your specs live as real, readable text on the page, or only inside a PDF datasheet?
That last point matters more than most manufacturing sites assume. Google can index the text inside a PDF, and has been able to since 2001, so “PDFs are invisible to Google” isn’t accurate. What is true: an HTML page is easier to update, easier to link to with real anchor text, and easier to read on a phone than a PDF. A PDF datasheet is real content that’s simply harder to work with, not content Google can’t see at all.
Evidence to pull: Search Console’s query-to-page mapping, cross-checked against GA4 engagement for that same page. Poor engagement alongside good impressions can point to a mismatch between the search and the page, but don’t conclude that from the numbers alone. Open the query and the landing page side by side and check manually. Good engagement with no conversions suggests the problem may sit further downstream, in Stage 3 or 4, but check the actual page and conversion path before drawing that conclusion.
When this is broken, a spec-level search lands on your homepage or a generic products grid, one catalog page tries to serve dozens of unrelated queries, or a PDF outranks the HTML page that could have actually converted.
What the finding means:
- Healthy: your top-query landing pages match the query, confirmed manually.
- Needs attention: some queries land correctly; others land somewhere generic.
- Critical: your best traffic consistently lands where it can’t get an answer.
Fix by duplicating your core spec data as real HTML on the matching page, and keeping the PDF as a secondary download for buyers who still want it.
STAGE 03 / 06
Buyer evaluation
What you’re checking: given that someone landed on the right page, do they now have enough to trust you and move forward?
Thomasnet surveyed more than 400 verified industrial buyers on what actually matters when shortlisting a new supplier. Delivery performance and lead times came out on top. Buyers said a slow or missing response to a quote request eliminates a supplier from consideration outright, and most expect a reply within 24 hours. Separately, Thomasnet has found that 40% of B2B buyers rate the quality of a manufacturer’s own website as an important factor in choosing who to work with.
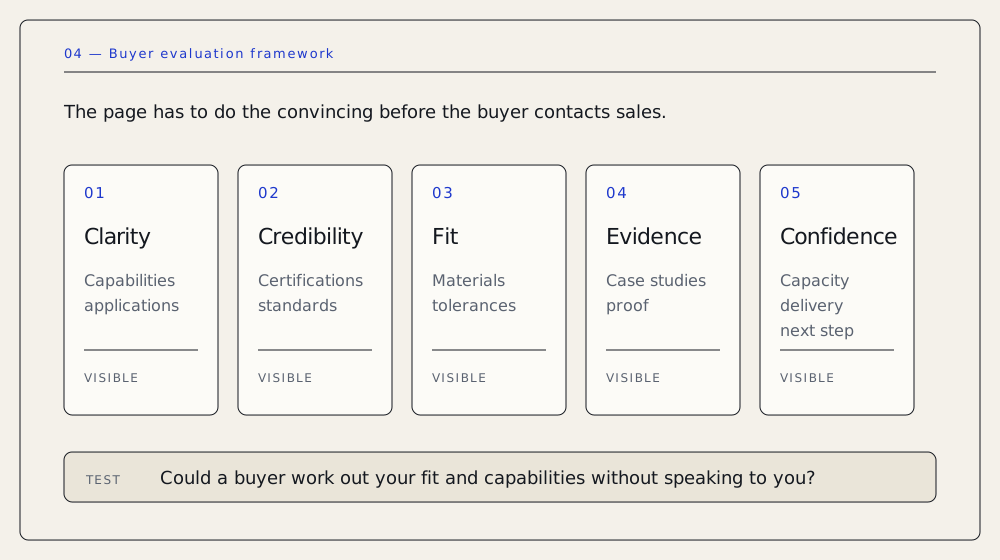
A purchase like this often involves more than one person, maybe an engineer or plant contact, someone in procurement, someone who signs off, depending on how big the order is. They don’t always talk to your salesperson directly, and they may not all look at your site the same way. That’s part of why the page itself has to do the convincing: can you make what I need, are you certified for it, can I see proof and not just a claim, and can I actually get a quote without a fight?
There’s a specific mismatch worth naming here. An RFI, a request for information, is what a buyer sends while they’re still comparing options. An RFQ, a request for quote, is what they send once their spec is fixed and they just want a price. An RFP, a request for proposal, is different again: the buyer wants you to propose the approach, not just quote a price on a fixed spec. If your product pages read like RFI-stage capability marketing, but the buyer arrived already RFQ-ready, you’re answering a question they stopped asking a while ago.
Check:
- Do your product and application pages answer real buyer questions: capabilities, tolerances, materials, certifications, applications served?
- Are your certifications and standards visible without hunting?
- Is your proof, case studies, capacity numbers, the customers you serve, specific rather than generic?
- Does the page match the stage the visitor is actually in: RFQ-ready, or still comparing?
Evidence to pull: a manual audit of your top 5 to 10 commercial pages against those Thomasnet factors, and a check of whether specs live as real HTML or only inside a PDF.
When this is broken, specs are buried in a PDF, the page uses internal SKU language instead of the application language buyers actually search, certifications are missing, or capability claims have nothing behind them.
What the finding means:
- Healthy: a buyer who’s never spoken to you could work out your fit and capabilities from the page alone.
- Needs attention: the information exists but is hard to find, or the proof is thin.
- Critical: the page reads as a pitch to a buyer who already knows exactly what they need.
If you’re not ready for a full audit, our RFQ Path Checker is worth knowing about, though it reviews your RFQ form, not the page content covered in this stage.
STAGE 04 / 06
RFQ conversion path
What you’re checking: once someone decides to act, is it actually easy to?
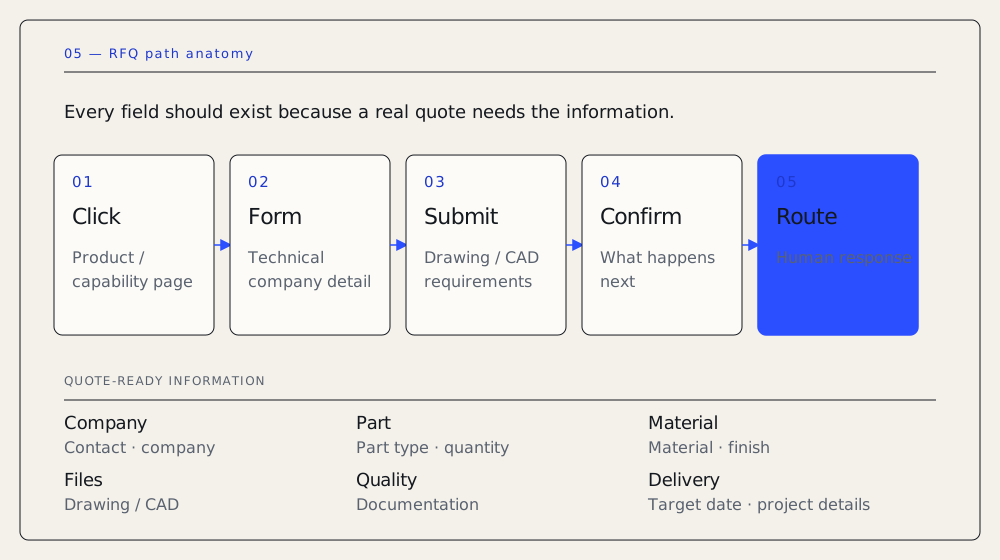
Real manufacturer RFQ forms, the ones that actually get used, tend to ask for the same core things: contact and company info, part type, quantity, material, surface finish, a drawing or CAD file upload, required quality documentation, a target delivery date, and an open field for project details. File upload isn’t an edge case on a form like this. It’s expected.
There’s a lot written online about form-field count and conversion rate, with suspiciously precise numbers attached, claims like cutting a form from 11 fields to 4 lifting conversion by 120%. We looked into it, and those figures don’t hold up. They conflict with each other and don’t trace back to a real, checkable study for B2B manufacturing forms specifically. So we won’t hand you a number, because an honest one doesn’t exist for your site without an actual audit.
What does hold up is the principle underneath it: every field should exist because a quote can’t be produced without it. That’s a different standard than “keep it short.” On an ecommerce checkout, an extra field is friction for its own sake. On a manufacturing RFQ, a missing field, tolerance, quantity, a drawing, forces your team to either pad the quote for risk or spend a cycle asking the buyer to clarify. Both slow down the exact response time buyers say determines who gets shortlisted.
Check:
- Is the path to requesting a quote obvious from every relevant product or capability page?
- Does the form ask for what’s genuinely needed to produce a real quote, and nothing more?
- Can a buyer attach a drawing or spec file?
- Does the form actually work on a phone?
Evidence to pull: submit the form yourself as a test, try it on mobile, and note exactly what happens after you hit submit.
When this is broken, the RFQ button is buried below the fold or missing from product pages entirely, the form asks for information a quote doesn’t need while skipping fields it does need, there’s no confirmation telling the buyer what happens next, or the form breaks on mobile.
What the finding means:
- Healthy: the path is obvious, the fields match what a quote actually requires, and the buyer gets a clear confirmation.
- Needs attention: the form works, but a field or two is debatable, or the confirmation is weak.
- Critical: a real, qualified buyer would be lost at this exact step: no CTA, a broken mobile form, or no confirmation at all.
If you want to check your own form against these questions without a full audit, run it through our RFQ Path Checker.
STAGE 05 / 06
Sales handoff
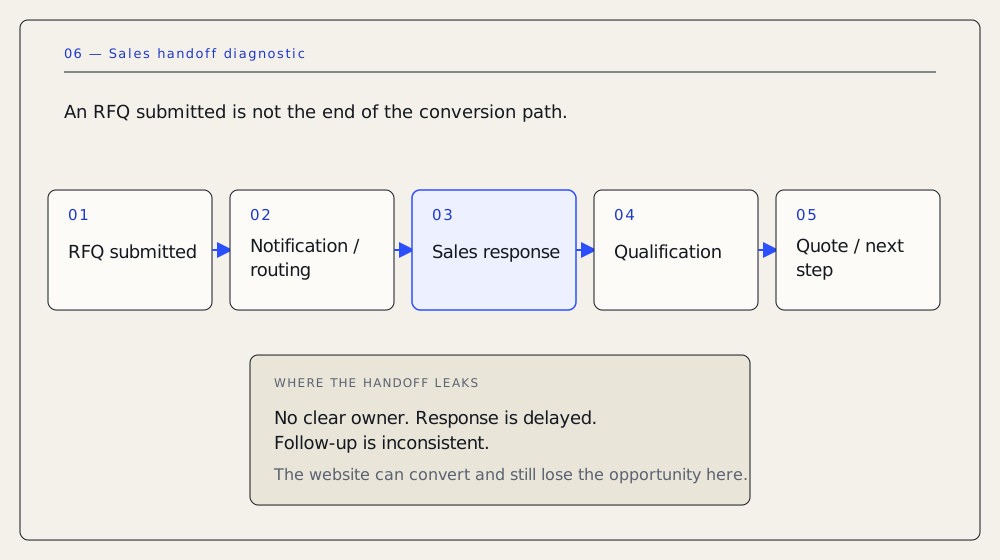
What you’re checking: once an RFQ actually arrives, does it get a fast, human response?
One scope note first: this stage covers what a marketing or website diagnostic can actually see and influence, where the submission goes, how fast someone answers, whether the buyer is told what to expect. It doesn’t evaluate your internal quoting accuracy, pricing, or production scheduling. That’s a different problem.
The best-evidenced statistic in this entire Playbook is about response time. Harvard Business Review audited 2,241 U.S. companies using a real test web lead: 37% responded within an hour, 16% responded within 1 to 24 hours, 24% took longer than a day, and 23% never responded at all. Companies that answered within the first hour were roughly seven times more likely to qualify the lead than companies that waited even one hour longer.
You may see this cited elsewhere as “21x,” “100x,” or a “42-hour average response time.” Those figures circulate widely, but we couldn’t trace any of them back to an independently checkable source. We’re citing HBR’s own numbers directly, on purpose.
Check:
- How long does it actually take a real RFQ to reach a human? Measure it. Don’t assume it.
- Does the buyer get an acknowledgment immediately, separate from the human follow-up?
- Is there a backup if the person who normally handles RFQs is out?
Evidence to pull: a timestamped test submission, and whatever CRM or inbox rule currently routes these.
When this is broken, RFQs land in one person’s inbox with no backup, there’s no auto-acknowledgment so the buyer isn’t sure the request went through, or responses take multiple days.
What the finding means:
- Healthy: response is fast and consistent, with a backup in place.
- Needs attention: response happens, but it’s inconsistent or slow.
- Critical: RFQs sit for days, or disappear into a single inbox with no backup and no acknowledgment.
STAGE 06 / 06
Measurement and feedback
What you’re checking: do you know which of the above is your real problem, or are you guessing?
This stage is different from the other five. It’s the last one, and it’s also worth checking first, since several of the diagnostics above assume basic tracking already exists.
Check:
- Are GA4 and Search Console both connected and verified?
- Does an RFQ form submission fire a trackable conversion event?
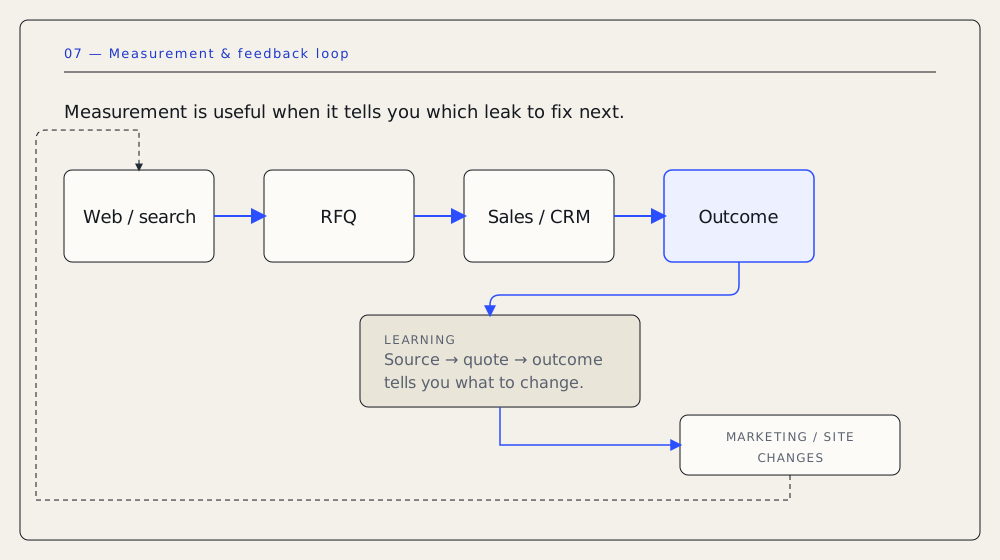
- Can a web-sourced RFQ be traced through to an actual quote, and ideally to a won or lost outcome?
For most lean-marketing manufacturers, that last one is the real gap. Leads come in through the site, but few companies tag them all the way through to a closed deal. Marketing and sales end up disagreeing about what’s working with no shared evidence to settle it. That’s our own judgment based on the pattern we see repeatedly, not a cited statistic, but it’s a gap that shows up constantly.
When this is broken, there’s no conversion tracking on the RFQ form at all, RFQs get counted as a raw number with no source, or nothing connects “form submitted” to “quote sent” or “deal won.”
What the finding means:
- Healthy: you can trace a web RFQ from submission to outcome.
- Needs attention: you’re tracking submissions, but not outcomes.
- Critical: you can’t currently answer how many RFQs came from your website last quarter, or what happened to them.
Diagnostic Decision Tree
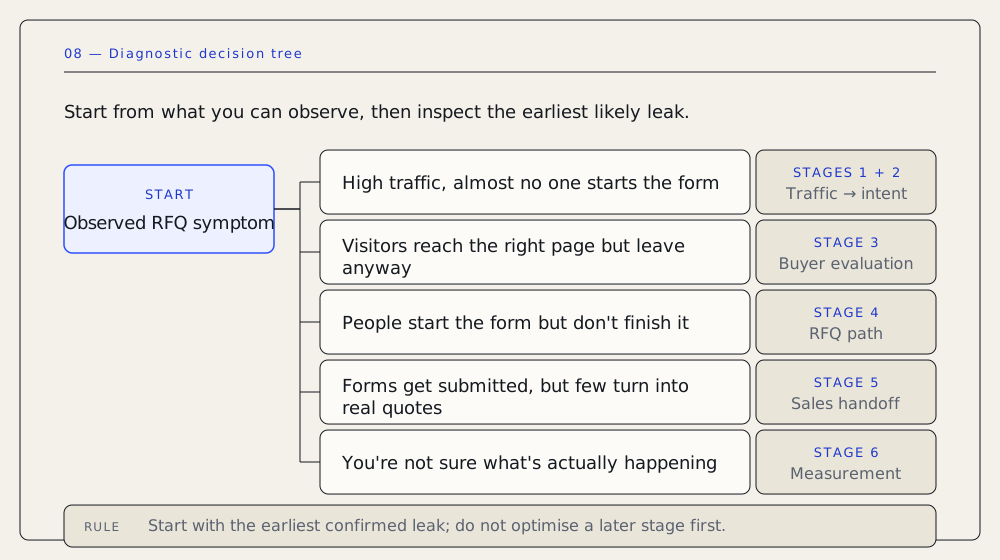
If you’d rather not read all six sections before acting, start from what you’re actually observing:
- High traffic, almost no one starts the form → check Stage 1 and 2.
- Visitors reach the right page but leave anyway → check Stage 3.
- People start the form but don’t finish it → check Stage 4.
- Forms get submitted, but few turn into real quotes → check Stage 5 first; if the handoff itself looks fine, the issue may sit inside your sales or quoting process and need its own look.
- You’re not sure what’s actually happening → start with Stage 6 and fix your measurement first.
What to Fix First
If you found more than one problem, start with the earliest confirmed leak that has a clear path to improvement. Do not optimize a later stage while a major earlier leak is still unaddressed. Speed is a separate factor worth weighing: sales handoff and RFQ-path fixes (a confirmation message, a backup inbox, a missing form field) can often happen in a day, while traffic quality and content fixes take longer, since they depend on search engines re-crawling and re-ranking your site.
When an Audit Makes Sense
Some issues in Stages 4 through 6 are straightforward to fix on your own once you know what’s broken: a form field, a confirmation message, a tracking setup. Others touch your website, analytics, CRM, and sales process all at once, and those take more coordination. Stages 1 through 3 tend to be harder to fix alone, especially when more than one is happening at once, or when you genuinely can’t tell which stage is at fault from your own analytics.
Get a Second Set of Eyes on It
If you’ve worked through this and you’re still not sure where your leak is, that’s exactly what an SEO audit is for.
We walk through this same six-stage framework against your actual site and your actual data, not a generic checklist.
If you’d rather start smaller, run your RFQ form through the RFQ Path Checker first.
A Note on This Framework
The six stages above are our own diagnostic model, built from the research cited throughout this Playbook. They aren’t a published industry standard; no research body publishes a “traffic quality → search intent → evaluation → RFQ path → handoff → measurement” model by that name. What the research does support is that each of these six checkpoints corresponds to a real, evidenced failure mode. We connected them because most manufacturers we talk to are dealing with more than one at once, and most existing advice only ever looks at one.
Sources
- Gartner, B2B Buying Journey research: the 17% figure on time spent meeting suppliers
- 6sense, survey of 900+ B2B buyers: the 70% figure on when buyers first contact a seller
- Google / Millward Brown Digital, B2B Path to Purchase study, 2014: search behavior before contacting a company, and the 57% figure
- Thomasnet, industrial buyer shortlisting research: the 400+ buyer survey, response-time expectations, and the 40% website-quality figure
- Harvard Business Review, Oldroyd, McElheran & Elkington, “The Short Life of Online Sales Leads,” 2011: the 2,241-company response-time study
- Google Webmaster Central Blog, PDF indexing documentation, 2011: confirms Google indexes PDF text
Downloadable worksheet
Take the Audit with you.
The PDF includes the printable Diagnostic Summary, with space to mark each stage, record the earliest confirmed leak, and write down your first action.